Economic growth builds the ranks of Kenya’s newly rich
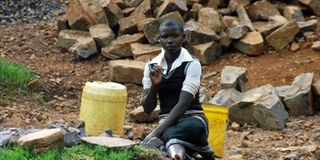
A girl breaks building ballast for sale in Nyamira County, western Kenya. A new study shows the poorest segment of the population shrank in the past four years as the middle class expanded, adding impetus to consumer market activity. File picture
What you need to know:
How they live, what they own and what they eat People in LSM 1 eat traditional foods, keep their savings at home, live in traditional houses that have no running water nor electricity.
They are also measured according to their possession with those owning a goat, wheel barrow and a bicycle classified as belonging to LSM 2.
A few more goats, the odd chicken, a paraffin stove, a part-time job to supplement household income moves a household to LSM 3. Add a parcel of land to grow food to better fashion the dining table and they graduate to LSM 4.
The difference between LSM 5 and 6 is marginal with access to a colour television and a savings account separating the two tiers. Since 2007, LSM 1 has reduced from 12 per cent of the population to 1 per cent, LSM 2 (25 to 10 per cent), LSM 3 (18 to 19 per cent) with similar reductions in percentage points for the rest of the lower class LSMs. LSM 7 and 8, where the middle class creep in, have had increases from 6 to 11 per cent and 4 to 6 per cent respectively.
Millions of poor Kenyans defied strong economic headwinds of 2008/2009 to increase their purchasing power and climb the social ladder, a new study of living standards shows.
Life has become better for millions of Kenyans at the bottom of the social pyramid, cutting their lot to a mere one per cent of the population, according to the Kenya Advertising Research Foundation (Karf), the agency that measures living standards based on an individual or a household’s ability to buy and to consume goods and services.
The findings that are expected to generate fresh debate over the impact of economic growth that Kenya has realised since President Kibaki came to power nine years ago show that the lot of the very poor has improved, cutting down their number while swelling the ranks of the middle class.
Karf says the number of the poorest Kenyan households dropped from a high of 12 per cent of the population in 2007 to one per cent early this year, confirming recent claims by economists that the country is undergoing a major social transformation driven by rapid migration to urban areas.
Unlike official government data, which uses income and level of education to determine the welfare of households, Karf uses the Living Standard Measure (LSM) to classify households into 17 categories.
LSM refers to a household’s consumption habits as measured by ‘affluence’ – which refers to ability to purchase and consume a wide range of goods and services.
According to this classification, the poorest segment of the population belongs to LSM1 while LSM 17 represents the richest segment of the population.
Kenya’s population has traditionally been divided into bottom, middle and upper classes with the bottom class making LSM1 to LSM6. Households that fall between LSM7 and LSM12 form the middle class while the upper class is made up of those occupying LSM13 to LSM17.
Economic Survey 2011, which used Nairobi as its base sample says 72 per cent of Kenyan population belong to the lower class, 24.1 per cent to the middle and 3.6 per cent in the upper classes.
This represents a marked improvement from 2007 when the bottom class accounted for 80 per cent of the population, 19 per cent belonged to the middle class while the upper class was made up of only one per cent of the population.
Kenya National Bureau of Statistics ranks lower income earners as those spending less than Sh23,670 per month, middle class (Sh23,671 and Sh119,999) and upper class above Sh121000. It further divides the upper and middle class into two tiers of upper-upper, lower-upper, upper-middle class and lower middle class while the lower class remains un-segmented.
Progression of an individual or a household from one LSM to the next means a rise in purchasing power that facilitates the buying and consumption of more goods and services and is a trend that most producers of goods and services regularly monitor to keep abreast with emerging market trends.
The Karf study shows that in the past four years, as more Kenyans migrated to urban areas, the ranks of the poorest – or bottom class – have been gradually diminishing.
This progression has benefited the ranks of the middle class that has used its newly-acquired affluence to deepen its presence in the consumer market.
“This, for instance, is what explains the steady rise in the number of Kenyans buying imported furniture, electronics and use of the internet in the past five years,” said Joe Otin the head of media monitoring at consumer market research firm, Synovate.
Kenya’s consumer market has grown steadily to become the key driver of economic growth and was valued at Sh1.3 trillion or 75 per cent of GDP in 2007 compared to Sh1.9 trillion or 77.8 per cent last year. Migration of the bulk of the poorest in the bottom segment of the population from LSM1 to the range of LSM3-LSM6 has also helped expand the lower end of the consumer market and is behind the recent explosion of micro-packaging by Kenya’s manufacturers targeting what is popularly known as the Kadogo economy.
John Mutua, a researcher at the Institute of Economic Affairs, says the change in consumption patterns is the clearest evidence of the social transformation that has occurred in the past four years.
“The increase in the number of fast food chains, refined tastes, the population and diversity in car brands on Kenyan roads are signs of the increased affluence,” says Mr Mutua.
X N Iraki, a lecturer at the University of Nairobi’s Business School, says rising consumerism signals that the economic plight of the average Kenyan has improved and is having a multiplier effect on the economy, especially for the middle class.
He reckons that a fatter wallet means Kenyans have more purchasing power that is raising demand for goods and services. Dr Iraki, says this growth of purchasing power offers entrepreneurs new opportunities to make money, and is the reason the middle class is the group everyone is chasing, including in far-flung places such as China.
Analysts say economic progression of the past 10 years makes governance and political reforms even more imperative to forestall a possible turmoil arising from denial of freedom to a middle class that has become conscious of its rights.
“The newly rich tend to demand more freedom and in extreme cases have forced new leadership on society as has recently happened in North Africa and the Middle East,” said Dr Iraki.
As the country moves into the next decade of growth, concern is growing over the emerging business environment that is characterized by high level inflation, exchange rate turbulence – and its impact on social welfare.
Inflation has throughout history had the impact of eroding consumer purchasing power and even pulled individuals and households down the socio-economic ladder – ultimately slowing down growth.
Beyond reach
Samuel Nyandemo, an economics lecturer at the University of Nairobi, says factoring inflation may paint a not so rosy picture and may leave households mark-timing at the same spot or even become poorer in the near term.
“You cannot talk of economic improvement when prices of basic commodities are rising as this only makes the situation worse,” said Dr Nyandemo.
British charity Oxfam last week released a new report showing that prices of consumer goods are already at an all time high in many African countries taking staple foods beyond the reach of millions. Shauri Halimu, a sociology lecturer at Kenyatta University, says the importance of the village folks and their ways is the reason vernacular radio stations continue to grow in popularity – a development he says is here to stay.