Pinebridge Investment chief operating officer George Horning (left) and East Africa CEO Jonathan Stichbury during a past media briefing in Nairobi. PHOTO | SALATON NJAU |
What you need to know:
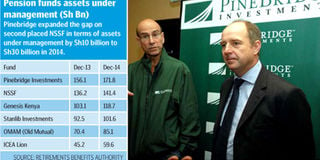
Pinebridge first shot to the top among fund managers in December 2013, surpassing NSSF with a Sh20 billion gap that has now expanded to Sh30 billion.
NSSF had a higher exposure to equities for the year, meaning it paid a higher price for the slowdown in the bourse in 2014 compared to 2013.
Overall, the growth rate of assets under management slowed down in 2014 compared to the previous year.
Private fund manager Pinebridge Investments widened the gap on National Social Security Fund (NSSF) with the difference in assets under management rising a further Sh10 billion in 2014, latest available industry data shows.
Pinebridge first shot to the top among fund managers in December 2013, surpassing NSSF with a Sh20 billion gap that has now expanded to Sh30 billion.
According to the Retirements Benefits Authority (RBA) 2014 report, assets under NSSF management grew by only 3.8 per cent, from Sh136.2 billion to Sh141.4 billion in the year to December 2014, the lowest growth rate among the top six fund managers in the country.
Pinebridge grew at 10 per cent from Sh156.1 billion to Sh171.8 billion over the period, while Genesis Kenya saw assets under management rise by 9.3 per cent from Sh103.2 billion to Sh118.7 billion to close the gap on NSSF by Sh10.3 billion.
“Pinebridge Investments is the manager with the largest assets under management at Sh171.8 billion, 24 per cent of the total assets under fund management,” said RBA in the report.
“Top tier fund managers Pinebridge, Genesis Kenya, Stanlib Investment Kenya, OMAM (Old Mutual) Asset Managers and ICEA Lion continue to manage the bulk of the investments with the total assets under management at Sh536.3 billion accounting for 73 per cent of the entire assets under management.”
Overall, the growth rate of assets under management slowed down in 2014 compared to the previous year.
Last year, the assets under management grew by 13.1 per cent from Sh696.68 billion to Sh788.15 billion. In 2013 the industry’s rate of growth stood at 27 per cent (from Sh548.7 billion in December 2012), which reflected bumper gains from the equities and bonds market and upward revaluation of property investments.
ICEA Lion and OMAM, however, recorded higher than industry average growth rates at 32 per cent and 21 per cent respectively.
“The decline in the growth of the industry assets can be attributed to the poor performance of the bourse and the changing interest rates in the market that have affected the debt instruments,” said RBA.
NSSF had a higher exposure to equities for the year, meaning it paid a higher price for the slowdown in the bourse in 2014 compared to 2013.
The public scheme’s equities portfolio accounted for 41.8 per cent of its total assets under management, compared to the average of 24 per cent for the private fund managers.
Private funds draw their contributions from employees’ salaries, meaning they can grow their pool of investable resources as wages rise, unlike the NSSF which receives a flat contribution of Sh400 per contributor.
NSSF was expected to grow its collections with the implementation of higher deductions, but these have been on hold due to legal hurdles.
Also, some of its investments have faced delays, locking in funds.
PAYE Tax Calculator
Note: The results are not exact but very close to the actual.