Follow the money. That’s probably what any seasoned cop investigating a corruption scheme would do if he/she’s to be successful. But that advice applies in investing too. If you can figure out where the big-money investors are directing their capital, you can invest alongside them and generate significant profits for yourself.
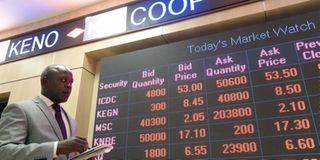
Why is this of value? Well, you probably know by now that foreign investors account for roughly two-thirds of all daily transactions at the bourse. Out of the Sh171 billion traded last year, Sh111 billion was as a result of foreign investor trading. What’s important, these investors appear to have an uncanny ability of buying and selling almost at the right time. Want to know what these investors are up to? Here’s where the Foreign Investors buy/sell ratio (FIB/S) can help.
FIB/S is a technical indicator which divides total foreign investor buys and sales every month. When the ratio is above (below) one, it means foreign investors are net buyers (sellers).
Typically, readings above one reflect bullishness and the opposite is true for readings below one. For instance, in January, the indicators’ reading stood at 0.92 meaning there were more foreign sellers than buyers in that month.
Readings above two show extreme bullishness while readings below 0.5 show extreme bearishness. Unfortunately, what the indicator does not show are the individual stocks these investors are putting money in.
However, tracking the usual suspects – Safaricom #ticker:SCOM , EABL #ticker:EABL , Equity #ticker:EQTY , KCB #ticker:KCB , Cooperative #ticker:COOP , Barclays #ticker:BBK , Britam #ticker:BRIT et cetera – one can easily overcome this problem. Like all indicators, its value is in the interpretation. What FIB/S adds to investor insight is its contrarian value.
Its contrarian nature has proved valuable in the past. To make you appreciate, let’s go back three years. In 2015, while the rest of the market was busy selling (markets dropped 10.9 per cent that year), foreigner investors clustered on the buy side eventually pushing FIB/S 12-month average to 1.06.
September was the most bullish month ever as the FIB/S ratio registered a three-year high at two meaning foreign investors bought twice as much as they were selling.
The following year, while the market dropped further (suffered an 8.3 per cent decline), foreign investors were net buyers in nine of the 12 months.
FIB/S 12-month average stood at 1.05. But when last year rolled in and shares soared (market ended 28 per cent higher), foreign investors flipped positions.
They were net sellers in eight of the 12 months. FIB/S 12-month average moved into bearish territory as it dropped to 0.92.
Here’s the bottom line. Use the signal if your nerves are made of steel. Buying (selling) when others are selling (buying).
Currently, the indicator has been on a downward trend (January reading stood at 0.90, down from 1.07 in October 2017) indicating a contrarian drift to sell when the rest of the market is rising.
Shares are up 11 per cent from last October to January this year. In all, pay attention to changes in the current sentiment to above one. But pay close attention when the signal begins flashing above two.
Mwanyasi is managing director, Canaan Capital Limited | [email protected]
Unlock a world of exclusive content today!Unlock a world of exclusive content today!