Time flies with great content! Renew in to keep enjoying all our premium content.
Prime
Can Kenya defeat poverty by 2030? What the global clock indicates
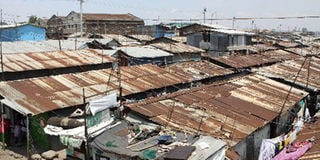
A section of Mukuru kwa Reuben slum in Nairobi. One of the Millennium Development Goals is to eradicate extreme poverty and hunger. Sub-Sahara Africa is yet to meet the goal. FILE PHOTO | NMG
Like other African countries emerging from colonial rule, Kenya’s independence leadership proclaimed a development focus on the elimination of three ills: poverty, ignorance and disease.
The last two have been addressed, with mixed success, through program or project-specific education and health initiatives over time. But poverty is more complex; its reduction, or eradication, is a higher-order task.
Kenya’s Poverty in context
Going back 40 years, poverty incidence in Kenya was “officially” estimated at 48 percent in 1981, before a more credible 51 percent estimate emerged from the 1997 Welfare Monitoring Survey. The 2005/6 Kenya Integrated Household Budget Survey offered a 46.6 percent poverty headcount.
Kenya’s most recent official poverty data was published in the 2015/16 Kenya Integrated Household Budget Survey, which updated the earlier 2005/06 one. The overall poverty headcount fell from a CPI-adjusted 46.8 percent in 2005/06 to 36.1 percent in 2015/16.
The actual headcount fell from 16.6 to 16.4 million — a poverty reduction rate of 20,000 Kenyans a year (just over 50 persons per day) — in a decade in which the population rose by 10 million.
Extreme poverty fell from 19.6 percent to 8.6 percent during the period and food poverty from 44.4 to 32 percent. In counties, poverty headcount ranged from 16.7 percent in Nairobi to 79.4 percent in Turkana, which also recorded the highest extreme poverty at 52.7 percent and food poverty at 66.1 percent against Nyeri’s 0.2 percent (extreme poverty). Food poverty in Nyeri and Meru was at 15.5 percent.
Of what use was this data? The 2015/16 Kenya Integrated Household Budget Survey recommended growth and redistribution strategies at the macro level, equitable and pro-poor services at the sector level and better data usage at the institutional level.
Yet, how does one use data that is only available periodically and at significant time lag? Is there a different pathway to quicker and faster real-time data estimates to guide policy debate and responses?
Enter the World Poverty Clock
Welcome to the World Poverty Clock, an initiative funded by IFAD and Germany’s Ministry of Economic Cooperation and Development in response to calls for a data revolution to track and communicate progress on the 2030 Sustainable Development Goals (SDGs).
Developed by the World Data Lab, it is a digital platform focused specifically on SDG 1 — “ending poverty in all of its forms everywhere”.
Using an extreme poverty line of $1.90 per day in 2011 purchasing power parity (PPP) prices, the clock offers a real-time view of poverty reduction estimates across the globe to the end of the SDGs in December 2030.
While the clock models around income (and education) levels and distributions, results are communicated by total poverty headcounts and escape rates measured in persons per hour, minute or second.
The data modelling works stepwise: an official baseline (latest country survey available), “now-casting” to the present, and then forecasting to 2030. Source data comes from UN population forecasts, the World Bank’s PovCal database and International Monetary Fund medium-term global and regional economic outlook reports.
For the long-term to 2030, scenario building by the Vienna-based International Institute of Applied Systems Analysis on Shared Socio-Economic Pathways (covering all countries), and OECD, is used.
Launched in 2017, the clock presents poverty headcount data around two escape rates for each country, region or local demography; the target rate to 2030 and the current rate.
“No extreme poverty” applies where less than three per cent of the population lives in poverty. “On-track” and “Off-track” denote the current speed of poverty reduction against the target, while “poverty is rising” is self-explanatory.
For this article, the clock was “visited” on Sunday, August 1, 2021. What do we learn about its modelling of poverty reduction around the world in general and Kenya in particular in this Covid-19 era?
Africa is in trouble, but “bottom-up” India is doing miracles
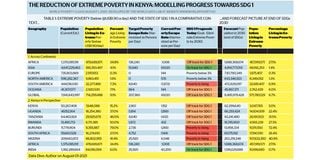
The clock’s website (www.worldpoverty.io), offers the clarification that current projections reflect the coronavirus pandemic’s impact on poverty reduction. As Table 1 indicates, in a world of 7.8 billion people now growing to almost 8.5 billion by 2030, today’s 714 million “extreme poor” will fall by around 140 million. Simply, SDG 1 will not be met at a global level.
Excluding largely “non-poor” Europe and North America, only Asia looks on track to achieve this SDG, where 85 percent of global poverty reduction will happen. Sixty percent of this is explained by an India whose national leadership has espoused (at least politically) “bottom-up” economic policy.
This is the same India that has been in a global “foot race” with Nigeria on absolute poverty headcount. As the modelling suggests, India will achieve SDG 1 by 2025, Nigeria will increase its poverty headcount by 20 million people by 2030. At the continental level, South America is the only location where poverty is rising.
Further, it is not Afro-pessimistic to observe that Africa is in real trouble, with a current poverty reduction rate that is effectively 99 percent off-target. This might partly explain why an Africa-specific version of the clock was launched in 2019, then mothballed. Debating poverty is bad politics in Africa.
Yet, in today’s ‘Africa Rising’ narrative around mega-infrastructure borrowing and spending, plus broad-based economic financialisation (to add to financial inclusion), the data modelling suggests, in pure numbers, that Africa’s 18 percent of the world’s people that currently accounts for 67 percent of the world’s poor, will be 20 percent of the world accounting for 80 percent of the world’s poor in 2030.
In regional terms, Kenya is a comparative oasis
Table 1 also offers a perspective on Kenya. Within the East African Community (EAC) region, no country is on track for SDG 1. Kenya today has the lowest extreme poverty rate in the region.
Currently, only Kenya and Rwanda have positive poverty escape rates, while Burundi stands out as the only place where the absolute poverty headcount will be higher in 2030 than it is today.
Looking wider, South Africa and (as stated earlier) Nigeria will also grow their poverty numbers.
Uganda, which is projected to have a larger population than both Kenya and South Africa by 2030, and Tanzania, which will have 20 million more people than Kenya by then, will account for 70 percent of this headcount of the poor, up from 67 percent today.
Kenya, which accounts for a quarter of the EAC population today, and will again in 2030, will halve its share of the regional poverty headcount from 10 to five percent, even as it records the lowest absolute headcount across the community.
The urgent need for smart geopolitical and innovative economic thinking underpinning this forward scenario of Kenya as the regional “oasis” cannot be overstated. If we recognise the clock’s modelling as a combination of public policy and private action and initiative, it is clear that Kenya’s “too important to fail” status as a regional anchor state cannot afford reckless politics. Internal regional disparities are self-evident.
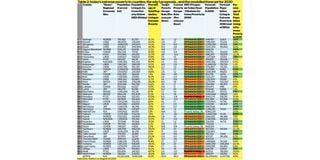
Kenya’s impressive data management ecosystem was used as an interesting global pilot on drilling the clock down to the subnational level. Table 2 provides a county-level prognosis on poverty reduction.
Excluding Nairobi and Nyeri, which are classified as “no extreme poverty” counties, a total of 20 out of the remaining 45 counties are projected to meet the SDG 1 target.
Eight of these counties — Kiambu, Kirinyaga, Laikipia, Meru, Murang’a, Nakuru, Nyandarua and Tharaka-Nithi — are drawn from the 10-member (including Nyeri) Central Kenya Regional Economic Bloc and only Embu is off-target.
Seven of the Lake Region Economic Bloc counties — Bungoma, Homa Bay, Kisii, Migori, Nyamira, Siaya and Vihiga — are also on target, as are Mombasa and Taita Taveta in the Jumuiya ya Kaunti za Pwani Bloc, Baringo and Elgeyo Marakwet in the Northern Region Bloc and Machakos in the South East Kenya Bloc.
In two Frontier Counties Development Council bloc, Mandera and Wajir, poverty is rising.
Overall, almost half (23) of the counties are off-target on SDG 1. These data points offer useful first hints on spatial inequality in Kenya, as well as opportunities to explore what works and does not across counties.
The Clock: A data opportunity to catalyse evidence-based “policy to action”?
The World Poverty Clock offers a fresh and interesting basis to tease out the roles of the public and private sector in poverty reduction.
The traditional query sought an overarching national policy environment to support income and wealth creation; akin to the macro-level growth and redistribution suggestions from the 2015/16 Kenya Integrated Household Budget Survey.
The new one encourages and demands fresh thinking about devolution’s role in poverty reduction, and, as noted earlier, the local, micro-level policies most appropriate to the task.
In a further sense, the clock also offers a potential scorecard on governor performance at outcome and impact level, beyond activities and projects.
Taken further, could the clock support political leaders and technocrats in evidence-based policy-making and purposive action within the counties that make up the economy?
Ignoring the data will definitely not help, but torturing it into submission might if Kenya is to accelerate its own poverty reduction pace, as it must, in line with the vision that SDG 1 represents.
Unlock a world of exclusive content today!Unlock a world of exclusive content today!