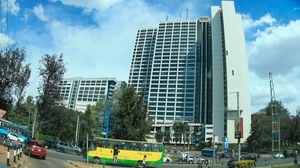
Higher-income households in Nairobi faced the sharpest rise in consumer prices in December 2023, a move away from the norm where inflation has impacted lower-income homes the most.
Data from the Kenya National Bureau of Statistics (KNBS) recorded inflation among Nairobi upper-income households at 6.62 percent in the month, which was in contrast to a 6.16 percent and 6.35 percent inflation rate for middle and lower-income households respectively.
The rate for Nairobi lower-income households came in at 9.23 percent a year earlier compared to 6.86 percent for upper-income households.
The KNBS describes Nairobi's upper-income group as households spending more than Sh184,395 per month which constitutes 3.5 percent of the households in the capital.
A majority of Nairobi households are described as low-income while an additional 25 percent of homes in the capital city fall under the middle-income group.
“Households spending Sh46,355 or less per month constituting 70.899 percent of all households in Nairobi fall in the lower income group while households spending Sh46,356 up to and including Sh184,394 per month make up the middle-income group, constituting 25.58 percent of all Nairobi households,” the KNBS notes.
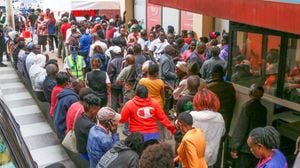
The rise in inflation for the upper-income group is largely attributable to higher pump prices where the rich households saw a heavier impact from higher transportation costs than the middle and lower income households.
In December, transportation costs recorded the only double-digit inflation rate across all categories, exposing higher-income households to greater consumer prices than the rest.
According to additional data from the KNBS, transport costs have a weighting of 17.63 percent of Nairobi upper-income household expenditures in contrast with 9.25 percent and 14.14 percent for lower and middle-income groups respectively.
This implies that higher transport costs will hit higher-income households harder than lower or middle-income homes.
Nairobi higher income households spend more on transport, health, furnishings, household equipment, routine household maintenance, restaurants and accommodation and insurance and financial services than lower and middle-income categories.
Transport, food
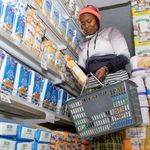
Spending on transport is, for instance, the highest, beating expenditure on food that takes up 16.81 percent of income.
In contrast, Nairobi's lower income and medium income households spend the bulk of their incomes on food at 36.32 and 21.65 percent respectively.
Households outside Nairobi, however, face the highest rates of inflation with the cost of living rate in December last year recorded at 6.84 percent, higher than the average of 6.63 percent during the month.
The KNBS collects data from Westlands, Kilimani, Hurlingham, Langata and Karen to represent Nairobi high-income households; South C, Nairobi CBD and Buruburu to represent the middle-income category and Githurai, Kawangware, Eastleigh, Kangemi, Dandora, Kariobangi, Kibera and Kayole to cover low-income households.