Agriculture, trade and manufacturing are the main growth drivers in top-performing counties.
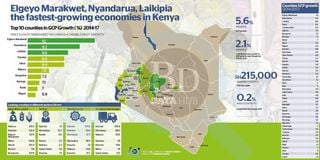
Elgeyo Marakwet, Nyandarua and Laikipia posted the fastest economic growth over the last three years, new data shows, signalling bigger employment and investment opportunities in these regions.
Siaya, Tharaka-Nithi and Nakuru also recorded sharp gross county product (GCP) growth over the period, the Kenya National Bureau of Statistics (KNBS) says following its first-ever study of the 47 counties’ wealth to ascertain how much each region contributed to the national cake.
Elgeyo Marakwet, with a 10 per cent GCP growth, outshone all counties — defying an overall trend of sluggishness. More than half of the counties reported GCP growth of below the average five per cent.
The overall GCP of the 47 counties amounted to Sh7.524 trillion in 2017 with the agriculture sector accounting for 37.7 percent, followed by manufacturing (8.6 percent) and trade (8.2 percent).
“Growth was volatile across counties during 2014 -2017,” says the study.
“On average, only Elgeyo Marakwet recorded double-digit growth.”
The remarkable performance by Elgeyo Marakwet comes on the backdrop of a decline in growth for some counties.
“Few counties experienced double-digit growth at least once during the same period including Busia, Migori, Tharaka- Nithi in 2017 while other counties have at least once experienced a contraction in economic activity including Nandi, Nyamira, Uasin Gishu and West Pokot in 2017.”
The rest of the top 10 counties include Bungoma, Baringo, Busia and Migori with growth rates of over seven per cent.
The KNBS describes the GCP as the net value of goods and services produced within the boundaries of a specific county. It is the equivalent of the county gross domestic product (GDP).
Nairobi’s contribution to the national wealth dispels the notion that the seat of power accounts for more than 60 percent of national output as previously widely held.
According to the study, the dominant counties are associated with large populations in urban centres.
In addition, the counties are backed by thriving economic activities such as agriculture, manufacturing, transportation, financial and real estate as well as wholesale and retail trade.
Agriculture, which is Kenya’s economic backbone, remains a key driver of growth in most counties with the exception of Nairobi and Mombasa. It helped counties such as Nakuru, Kiambu, Meru, Bungoma, Kakamega and Nyeri to record robust growth.
According to the report, more than half of county economic activity is driven by the services sector.
Agriculture is concentrated in Nakuru, Nyandarua, Kiambu, Meru, Bungoma and Bomet.
On the other hand, industrial activities are mainly based in Nairobi, Kiambu, Mombasa, Machakos and Nakuru while services are concentrated in Nairobi, Mombasa, Kiambu, Nakuru and Machakos.
The study shows that Nairobi, Nakuru and Kiambu are Kenya’s top-three richest counties while Lamu, Samburu and Isiolo are the poorest.
Nairobi, with a contribution of 21.7 percent to the overall GDP, is by far Kenya’s richest county, according to the KNBS listing.
The capital city is more than three-and-a-half times larger in economic terms than Nakuru, the second-richest county with a 6.1 percent share of the GDP.
Kiambu (5.5 percent), Mombasa (4.7 percent) and Machakos (3.2 percent) complete the list of Kenya’s top five wealthiest counties in GDP terms.
The rest of the top 10 counties are Meru (2.9 per cent), Kisumu (2.9 percent), Nyandarua (2.6 percent), Kakamega (2.4 percent) and Uasin-Gishu (2.3 percent).
“Nairobi seized the lion’s share of Kenya GDP at 21.7 percent,” said KNBS director-general Zachary Mwangi during the report’s release in the capital last week.
The report titled ‘Gross County Product 2019’ was funded by the World Bank.
It tracked the monetary measure of the market value of all the final goods and services produced in each of the 47 counties, with a view to providing a picture of the economic structure and relative size of the economy for each county.
“The latest data was drawn from regular data collected by the agency through recurrent and intermittent surveys and censuses and administrative records,” said the KNBS.
A survey was also conducted in all 47 counties in 2018 to supplement the existing data sets.
The counties that contribute the least to national wealth, according to the report, are Isiolo at 0.2 percent and Samburu at 0.3 percent. The others are Lamu (0.4 percent), Marsabit (0.5 percent), Tana River (0.5 percent), Mandera (0.5 per cent), Wajir (0.5 percent), Garissa (0.6 percent), West Pokot (0.7 percent) and Taita Taveta (0.5 percent).
Treasury Cabinet Secretary Henry Rotich has urged investors and county administrators to exploit the latest data to make investment decisions.
PAYE Tax Calculator
Note: The results are not exact but very close to the actual.