The Kenya Ports Authority has recorded an overall improvement in its key year on year performance indicators as well as an increase in cargo handled six months into the year.
In June the port handled throughput of 2,720,000-deadweight tonnage (DWT) representing a 0.6 per cent increase compared to the same month last year, a report released yesterday showed.
The growth is attributable to an increase in dry bulk and containerised cargo, which recorded an increase of 6.8 per cent and 10.6 per cent respectively.
January to June saw the port register a 2.4 per cent growth in throughput compared to the same period last year. Imports took a lion’s share of the throughput at 83.6 per cent, while exports registered 12.5 per cent. Transshipment cargo recorded 3.6 percent of the total traffic.
The strong freight figures were equally demonstrated by the growth of container traffic. In June, the port registered 106,153 Twenty Foot Equivalent Units (TEU’s) compared to 99,727 TEUs handled last year and posting an increase of 6.9 percent. The cumulative container traffic from January to June saw an increase of 5.3 per cent with the port handling 614,625 TEUs compared to 583,661 TEUs during a similar period last year.
Speaking on the performance report, KPA’s acting managing director Daniel Manduku said whereas the increase of throughput and container traffic is an indication of vibrant economic activities in the region, the performance indicators of the port authority had equally improved.
“Numbers give a concise picture and our performance indicators are showing an un-mistakable improvement. The indicators cover productivity and berth occupancy all of which have shown a distinct improvement,” he said.
“The performance report we are releasing today (yesterday) is a gauge of KPA’s mandate. However, the overall port experience for our customers is akin to a musical ensemble that requires all partner agencies and stakeholders to consistently harmonize.”
The service indicators show the average cargo dwell-time, port days that vessel stay at the port and container ship turnaround.
According to the performance report, the average container dwell time was at 3.4 days compared to 3.8 days last year. The average container dwell time is the average period containers stay at the marine terminal upon offloading from the container ship.
“It is expected that addition of the rail cargo freight services will have a positive impact on this measure,” the report said.
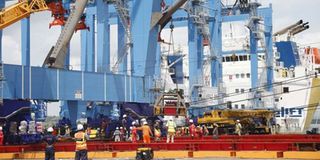
It indicates that vessels turnaround time was 4.5 days compared to 3.8 days last year during the same month. The drop is attributable to the disruptions during the delivery of port handling equipment in June.
“Another notable service statistic is the container ships turnaround. The average turnaround time corresponds to the length of time a ship enters the port’s limit and when it exits the confines of the port. During the month of June, container ships spent an average of 2.8 days at the port compared to 3.1 days last year,” it said.
June saw the breaking of two productivity records with container ship – Livorno - registering an average of 140 gross moves per hour to beat a record set a week before by MV Ever Dynamic’s of 129 gross moves per hour. The records surpassed a similar one set in 2015 by MV Kota Lambai’s of 82 gross moves per hour. Gross moves per hour is a maritime productivity term that defines the total container movement (on loading, offloading and repositioning) divided by the number of hours for which the vessel is at berth. In June, an average of 35 gross moves per hour were recorded compared to 28.1 movers per notched up last year.
Unlock a world of exclusive content today!Unlock a world of exclusive content today!