Kisumu and Nairobi have the largest proportion of informal settlements despite modest poverty levels among residents, an indication of the housing infrastructure shortfall facing the two cities.
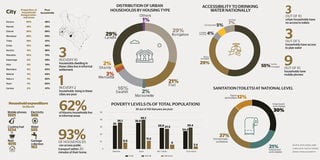
An estimated 62 percent of Kisumu is under informal settlements followed by Nairobi at 41 percent, research findings published in a policy working paper of the World Bank shows.
Interestingly, less than half or 49 percent of the urban population in Kisumu is considered poor while in Nairobi the figure stood at 43 percent.
This compares to an average 33 percent informal settlement coverage of all the key 15 towns sampled nationwide and mean poverty rate of 51 percent of households.
Other towns covered by the World Bank study included Eldoret, Embu, Garissa, Kakamega, Kericho, Kitui, Machakos, Malindi, Mombasa, Naivasha, Nakuru, Nyeri and Thika.
“In general, the percentage of households that were poor in monetary terms was much higher than the percentage of households that lived in informal settlements. Surprisingly, there was little correlation observed between levels of informality and poverty. Nairobi, which had one of the highest levels of informality, also benefited from the lowest level of poverty with only 43 percent of households sampled below the poverty lines,” says the World Bank study.
Garissa has the lowest proportion of informal settlement at two percent, followed by Nakuru, Malindi and Nyeri at two per cent each.
A UN Habitat report shows that Kisumu has seven informal settlements namely Nyalenda “A” (including Nyamasaria), Nyalenda “B”, Manyatta “A”, Manyatta “B”, Obunga, Bandani, Manyatta-Arab, and Kaloleni.
Nairobi on the other hand hosts several informal settlements including Kibera, Mathare, Kawangware,Korogocho and Mukuru.
Nairobi and Kisumu were last month ranked among the top 10 biggest contributors to Kenya’s Gross Domestic Product(GDP). Nairobi emerged top in the first-ever Gross County Product (GCP) 2019 study by the Kenya National Bureau of Statistics (KNBS), with a GCP of 21.7 percent in a five-year period of the study (2013-2017).
The rest of the top 10 counties include Nakuru (6.1 percent), Kiambu (5.5 percent), Mombasa (4.7 percent), Machakos (3.2 percent), Meru (2.9 percent) and Kisumu (2.9 percent), Nyandarua (2.6 percent) Kakamega (2.4 percent) and Uasin Gishu (2.3 percent).
Isiolo at 0.2 percent and Samburu at 0.3 percent trailed the list of contributors to the national wealth, according to the report.
Apart from the housing challenges, the World Bank study affirmed that Kenyans are spending more on airtime than on other essential items such as food and electricity, making it the single item that is squeezing family wallets to satisfy the allure for networking.
Phone is both the most popular service, as well as the most expensive and costs 50 percent more each month than other infrastructure services such as electricity, water and garbage collection.
“The data reveal that phone service (predominantly mobile phones) is on average the most expensive infrastructure service on a monthly basis for households,” says the Bank.
“Phone is consistently the most readily available service for all urban households and is the only sector where settlement type and household poverty levels make little difference to access.”
The Bank says that households allocate an estimated Sh1,805 per month to phone service. This, it says, is more than the mean amount allocated to home cooking fuel (Sh1,485) and a third of the amount allocated to monthly house rent (Sh5,433).
Poor households spend about Sh1,246 while non-poor ones spend at least Sh2,362. Relative to the overall budget for each type of households, the airtime spending tops household spending on infrastructure services.
The analysis further says airtime expenditure is 50 percent more than the next most expensive infrastructure service which is electricity at about Sh1,186 per month. Spending on piped water averages Sh668 per month while garbage collection costs about Sh196.
Apart from just checking whether a certain infrastructure is physically available, the working paper assessed on the level of actual usage and if or not the infrastructure is actually in good condition.
Here, mobile phone service scores high as the one where the available infrastructure is in good condition and also appealing to many people.
According to the WB, the high rates of coverage overall are testament to the impressive penetration levels achieved predominantly by mobile phone services throughout urban Kenya.
It also affirms the success story of telecommunication firms like Safaricom whose profits have been growing for the last six consecutive years. The WB says the spending also speaks to the connectivity of telcos across the country.
“Our data reconfirm the telecoms story — that private delivery of mobile phone service has been a success story in urban Kenya,” says WB, adding that the high rate coverage is despite the relatively high costs associated with the service.
The sector scores higher than public transport use. While 93 percent of all the households report that public transport is available within a 20-minute walk of their residence, the actual use is low.
“Despite the relative proximity of these services, however, the level of effective access (that is those households that use public transport service) is much lower; representing only about half of the households (52 percent),” observes WB.
It proposes that policy makers investigate what barriers might be inhibiting the use of public transport in towns before rolling out new investments or policies for public transit systems.
WB says policy makers have been obsessed with measuring whether a service is physically available yet such data provides little insight into the actual level of usage or functionality of any given service, let alone the quality.
Discrepancy between physical availability and level of usage is more marked in toilets, sewage disposal, access roads, public transport, garbage collection and street lights, according to the World Bank.
Only electricity performs consistently well across cities in Kenya, with high levels (more than 75 per cent) of both physical access and actual use.
The data, according to WB, confirms that investment over the last decade in expanding service coverage from its low base has been largely successful.
However, the picture is less satisfactory for other essential services. For instance, piped water is available to only 58 percent of households, and only 55 percent use it as a dominant source of water.
The paper points to supply problems, noting that only one in every four households (28 percent) benefit from continuous household water supply.
For other sectors, effective access widely differs from physical access. Fewer than half of households (48 per cent) have effective access to toilets even though nominal coverage is higher at 67 percent.
Only 42 percent of households have effective access to sewage, mostly funded by the private sector.
Only about a third of households have effective access to surfaced, all-weather roads (33 percent), working street lights (32 percent) or weekly garbage collection (38 percent).
Unlock a world of exclusive content today!Unlock a world of exclusive content today!