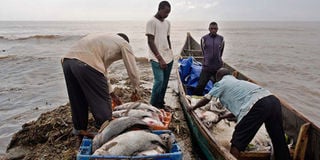
The number of privately owned fish landing sites on Lake Victoria has risen with most owners unable to meet the massive financial outlay needed to run operations while safeguarding the quality of fish as well as the health of the community.
A landing site should have such basic amenities as toilets, sheds, coldrooms, pontoon/jetties, potable water and electricity. Additionally, it should have access to an all-weather road to enable quick transport of the catch to the market, according to the Food and Agriculture Organisation.
This basic requirement is meant to keep waterborne diseases at bay and ensure that the fish coming from the the facilities at the landing sites is of high quality.
However, a joint report by the Fisheries Department, Lake Victoria Fisheries Organisation(LVFO) and the Lake Victoria Environment Management Programmes (LVEMP) notes that where the sites are owned by private individuals, such developments are hard to undertake.
“Although the number of privately owned sites had declined considerably between 2012 and 2014, this survey recorded an increase in the private sites which could curtail provision of services to the fishers,” the survey shows.
Inadequate amenities are already a concern in most Lake Victoria fish landing sites and the spring-up of more privately owned sites could worsen matters.
For instance the survey revealed that the number of sites with toilets declined from 232 in 2014 to 221 in 2016.
This means that out of the total 338 landing sites on the lake, 117 operate without a toilet, forcing fishers to answer the call of nature by the shores, which increases the odds of an outbreak.
Previously there had been a consistent increase of toilets from 49 per cent to 72 per cent between 2002 and 2014 but coverage has declined to 65 per cent of the landing sites in 2016.
Siaya County had the highest access to toilets at 80 per cent of the surveyed sites. Homa Bay, Busia and Migori followed closely with 65, 64 and 62 per cent respectively. Kisumu had the lowest access at 41 per cent.
The overall supply of potable water on the sites has also been remarkably low with only 25 against the 338 sites having access, according to the survey. Sanitation levels at the landing sites depend a lot with provision of potable water.
In 2010, 58 (18 per cent) of the landing sites were privately owned. The number shot up to 96 (30 per cent) in 2012, followed by a decline in 2014 to 34 representing 11 per cent of enumerated sites. In 2016, there was a 14 per cent rise bringing the total to 49.
At the sub-county level, Bunyala, Suba and Rarieda recorded the highest number of privately owned sites with each contributing 18 per cent of the sites.
Samia, Homa Bay, Rangwe, Kisumu East and Nyakach did not have any privately owned site. In Kisumu Central, Bunyala and Rarieda, 40 per cent, 39 per cent and 26 per cent of the sites respectively were privately owned.
Others were Nyando, Suba and Rachuonyo where 22 per cent, 21 per cent and 19 per cent of the sites were privately owned, respectively. The other sub-counties had less than 10 per cent of their sites privately owned.
Overall, Lake Victoria registered an increase in the number of fishers and fish landing sites.
The total number of sites increased from 321 in 2014 to 338 in 2016, marking a 5.3 per cent increase.
Most of the sites were found in Mbita (20.40 per cent), followed by Bondo (13.91 per cent), Suba (12.72 per cent), Rachuonyo (10.95 per cent), Rarieda (10.06 per cent), Nyatike (8.58 per cent), Bunyala (6.80 per cent), Seme and Kisumu West (both 3.25 per cent), Nyando (2.66 per cent) and Nyakach (2.07 per cent).
The number of fishermen also increased over the years. There were 40,653 fishers in 2016 compared to 40,078 fishers recorded in the 2014 survey, a slight increase of 1.4 per cent.
Unlock a world of exclusive content today!Unlock a world of exclusive content today!