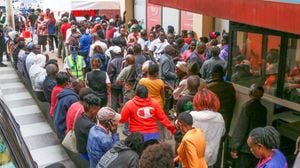
Near my office in Nairobi’s central business district, there is a bustling mobile money business. It opens early and closes late. There are five “agents”— who mimic bank tellers — on hand at any time to serve customers from booth-like stalls.
I live on Thika Road in an area that has refused to conform to city life. Although I am in Nairobi City County, there is a neighbour who rears cows. There is also a relative scarcity of mobile money shops.
I have to walk 15 minutes (20 on a hot day) to get to the nearest agent. There are no guarantees: the guy who owns the shop has only one phone line registered as a mobile money till and it is quite often out of float or power.
When the central bank or the Communications Authority of Kenya calculate the level of my access to mobile money services, they will count the mobile money shop in town five times (for the five tills) and my local establishment once.
Next year if the mobile money shop in town adds two more tills, they might even report a 33 per cent increase in the level of my access to mobile money services.
But the picture painted by these numbers is distorted. Even with the 33 per cent increase, I will still have to walk 15 minutes uphill if I really need to withdraw money from my Thika Road home.
Now take my situation and multiply by 45 million people. Expand it to the geography of Kenya and take into consideration the people whose access problems go beyond mere inconvenience— those that have to walk an hour or more. Perhaps then you will begin to see a problem in how we count mobile money agents.
When mobile financial service operators and government regulators report agent numbers, they are usually referring to tills— the number of SIM Cards that have been registered for use by agents.
But these statistics are all but silent on the locations of these mobile money services.
“We have a lot of data focusing on the tills, but nearly no robust and recent data on the location of these tills,” says Financial Sector Deepening (FSD) Kenya head of research, Ms Amrik Heyer.
Ineffective to rely on till data alone
A new study from the Helix Institute for Digital Finance uses an analogy to point to the futility of relying on till data alone to measure mobile money access.
Counting mobile money tills, the research argues, is like trying to measure the level of access to banking services by counting the tellers in the country.
It is likely that more than half of these tellers are in urban areas and without knowledge of the branch network, you will never know that a woman in rural Makueni has to take a bus to deposit money into her bank account.
The result? A too rosy picture of the mobile money market.
“Our calculations demonstrate that the use of agent till statistics in industry literature has led to an overestimation of global access to finance,” says the report co-authored by Vera Bersudskaya and Mike McCaffrey. The picture is further distorted given the growing lack of agent exclusivity. A mobile money agent that provides Orange Money, M-Pesa and Airtel services is counted three times in government data.
To demonstrate just how pink this rosy picture is, Helix took data from 2014 and with the help of a representative survey of the market tried to deflate agent numbers taking into consideration multiple tills in a single agent location.
Each mobile money shop was counted once— no matter how many tills were represented. The Institute also tried to account for inactivity.
At the time the agent count provided by regulators in Kenya was 123,703. When Helix accounted for mobile money outlets with multiple tills, 22,947 were shaved off the count.
Taking into consideration agents that had not been active in the last 90 days lowered the figures to 67,407— a 45 per cent reduction in the original figures provided by the government.
Consider geography
Helix argues that it is time for the market to start focusing on agents, rather than tills, and to report their locations as well as their activity. To return to my predicament, what Helix is proposing is counting the mobile money shop in the CBD once and the one near my home once.
Therefore, the government would take geography into consideration when measuring my access to mobile money services.
“Agent till statistics are useful for measuring overall industry growth rates. Their geographic distribution can reveal areas characterised by intense competition or single provider dominance.” Outlets, we believe, are better suited for measuring physical access,” says Ms Bersudskaya.
While mobile money experts may quibble with Helix’s broad conclusions, there is general consensus that as this sub-sector of financial services matures in its second decade, so must the associated data collection and presentation.
FSD Kenya, in particular, is championing not only including spatial data in the current reporting structures, but building a publicly accessible database of such information.
“At a very simplistic level the customer does not care how many agents there are, they want to know where the nearest agents are. You can’t have a proper estimate of financial access in Kenya without location data,” says Ms Heyer.
Ideally, it should be possible to have granular data at a ward or even county level detailing the direction and value of mobile money transactions for the whole industry.
However, under the FSD Kenya proposal, sensitive information would only be visible to the regulators and to the industry.
The use of such data extends beyond the customer being able to find the nearest agent with ease. It would be easier for financial service providers to identify holes in their networks.
It would be easier for the regulator to spot potentially suspicious transactions at specific locations.
Operators could become more flexible and more creative with the services they provide. For instance, there is a boarding school right next door to my house.
Every three months parents drive up to our neighbourhood only to remember that there is no mobile money agency close by where they can deposit money for school fees.
Ms Heyer argues that in such cases, operators could very easily deploy a mobile money agent next to the institution during back-to-school season and pull that agent back during the less profitable months of the year.
Given the prevalence of mobile money data in Kenya’s economy, location-based data on transaction patterns could also give the government a trove of policy-relevant information.
“You would have the most incredible data to understand the economy. It is the best proxy for economic activity that you could have,” says Mr David Taylor, a director at Usable Data.
Kenya’s telecoms are actively exploring the best way to pursue this. Organisations like FSD Kenya have also attempted their own censuses of the market. One of the obstacles involved is the cost.
Another obstacle is data protection. Telecoms are wont to guard data that can be used against them by their rivals. They might also have questions to raise about the regulators’ ability to protect the privacy of customer data.
Kenya is also yet to develop an industry standard for how such data would be collected and stored. A solution could be having a regulator-led exercise, as is happening in Tanzania.
Scepticism over submitted data
While the Communication Authority (CA) says that it has plans to carry out some data collection independent of the operators. Currently the CA relies on operators to submit their own data.
“It (till data) may not give us the accurate information but it is a challenge for us to see if we can entirely rely on the service providers or if we can design another way to do this,” said CA director-general Francis Wangusi.
Mr Wangusi also expressed scepticism about some of the numbers submitted by operators. Over the last one year, the data released by the CA on the telecom sector has been peppered with odd fluctuations and contradictions.
For instance, in the quarter to December 2016, Orange Money agents went from 20,694 to 800. Nevertheless, the number of transactions carried out on the network remained steady at 31,000.
“Telkom Kenya changed its reporting framework to focus on Telkom Kenya recruited agents solely without the inclusion of our banking partner’s agents that had been serving Orange Money customers,” was all the explanation that Orange money provided. Telkom Kenya had previously changed the way it reports its numbers, resulting in a “loss” of over two million phone subscribers in the three months to September 2016.
Discrepancies
If reliance on operators to count their own agents is problematic, the picture is further muddied when one tries to compare the statistics produced by different government institutions.
The data reported by the CA and the Central Bank never matches. So for instance while the CBK reported that the value of mobile transactions in the calendar year 2016 was Sh3.3 trillion, the CA has Sh4 trillion as its figure.
The figures for mobile money agents are closer with the CA reporting 161,583 for the October-December quarter while the CBK reported 181,456 agents for October, 162,441 agents for November and 165,908 agents for December.
Neither the Central Bank nor the CA has in the past been able to provide a satisfactory answer for these discrepancies.
One of the telecom operators provided a possible explanation for the state of affairs— “different reporting calendars.”
The Central Bank did not respond to questions for this story.
Unlock a world of exclusive content today!Unlock a world of exclusive content today!