Time flies with great content! Renew in to keep enjoying all our premium content.
Prime
It is a small rally at NSE but where are the volumes?
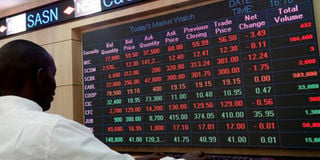
Trading at the NSE. The low volumes being witnessed despite a rally last week, should be a cause of concern. PHOTO | FILE
By close of last Thursday’s trading session, the Nairobi All-Share Index (NASI) had managed to trade up 5 per cent from its early September lows. Similarly, the NSE 20 share index has also gone up 2.6 per cent from the same level.
But even as the bear market begins to lose its inertia, the new price surge is spotting a very interesting characteristic – a lack of “strong volume” confirmation.
This is not a good sign since a good move is when volume confirms price, so that if a market rallies then volume should expand with it. This is the central tenet for market technicians.
Unfortunately, this has not been the case in the latest rally attempt. As a result, there is confusion as whether to treat the recent advance as a rally within a bear market or a beginning of a new bull market. So, what to do?
To begin with, it’s important to recognise that volume is an important market factor. But sadly, volume has to be the most underrated market indicator. Its use is very simple.
Volume will tend to expand in the main direction of the trend (i.e.) in a bull market, advances will tend to be accompanied by increasing volume while declines by low volume.
Conversely, in a bear market, declines tend to be accompanied by increasing volume and advances by diminishing volume.
That said, in order to get direction on this issue, it is important first to demonstrate the impact of volume to price action. A good example is the 2008 and 2010 markets.
In the former, as both prices and volumes dwindled (from 198.9 million in July 63.08 million in October) as a result of the meltdown, waning selling pressure pointed towards a near price floor.
Prices quickly recovered in the second quarter of 2009 supported by expansion in volume. As a result, NASI went on to stage a multi-year bull trend that closed 2009 and 2010 with a 20 per cent and 24 per cent return respectively.
However, as 2011 rolled in, volumes tumbled and prices soon followed with lower lows.
Declining weekly volume in NASI’s mini-rally – happens between February 2016 and April 2016 and bags 11.8 per cent in returns at its peak – ensured that it failed.
Although the volume decline was marginal, the price surge was only set to fail as the buying power was still very weak.
Indeed, 12 weeks after, the NASI lost 5.8 per cent on rising volume – a signal that bears completely overwhelmed the buyers in the market.
The situation may remain for a while as the latest rally attempt appears to be facing the same challenges – low trading volumes.
Clearly, one of the known missing pieces is the relatively low participation by the individual investor.
As you can see, for investors to confirm a change in market conditions, it is vital that they watch trading volumes closely. By this measure, the market’s recent rally has shown that it still has much to prove.
Of course, volume is not enough evidence to qualify a rally but it’s an important metric that investors should watch closely.
Mr Mwanyasi is the MD, Canaan Capital Limited.
Unlock a world of exclusive content today!Unlock a world of exclusive content today!